Gain sustainability insights from the perspective and expertise acquired from working with some of the best clients in the world.
Visualizing All the Nuclear Waste in the World
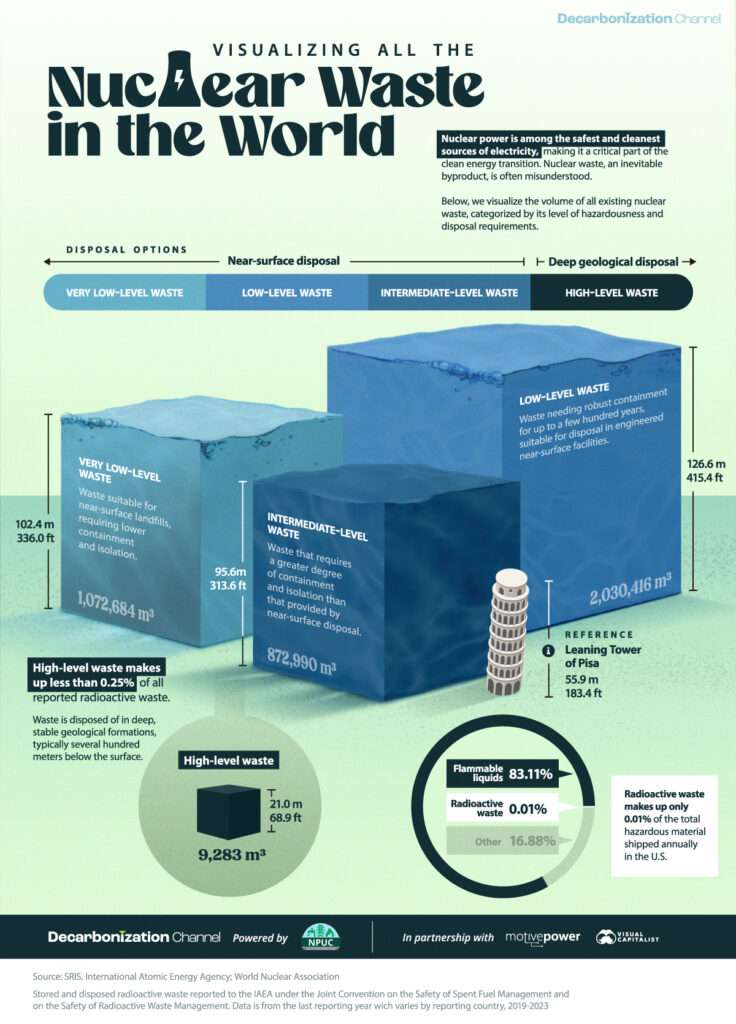
Visualizing All the Nuclear Waste in the WorldNuclear power is among the safest and cleanest sources of electricity, making it a critical part of the clean energy transition. However, nuclear waste, an inevitable byproduct, is often misunderstood. In collaboration...
Unpacking Hydrogen’s Role in Decarbonizing the Electricity Sector
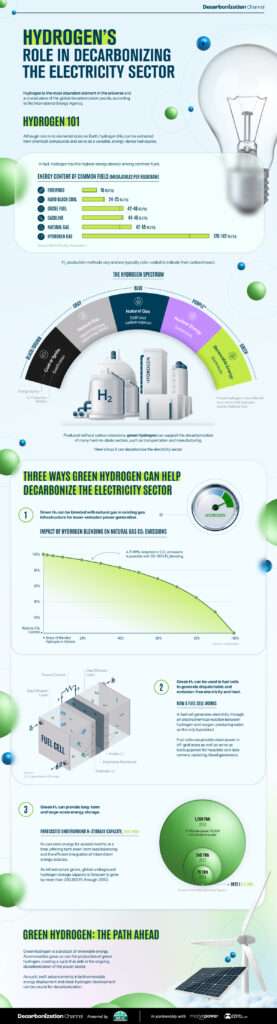
Unpacking Hydrogen’s Role in Decarbonizing ElectricityHydrogen’s Role in Decarbonizing the Electricity Sector Hydrogen constitutes 75% of the elemental mass in our universe. According to the International Energy Agency (IEA), it could also play a pivotal role in...
Mapped: Global Temperature Rise by Country (2022-2100P)
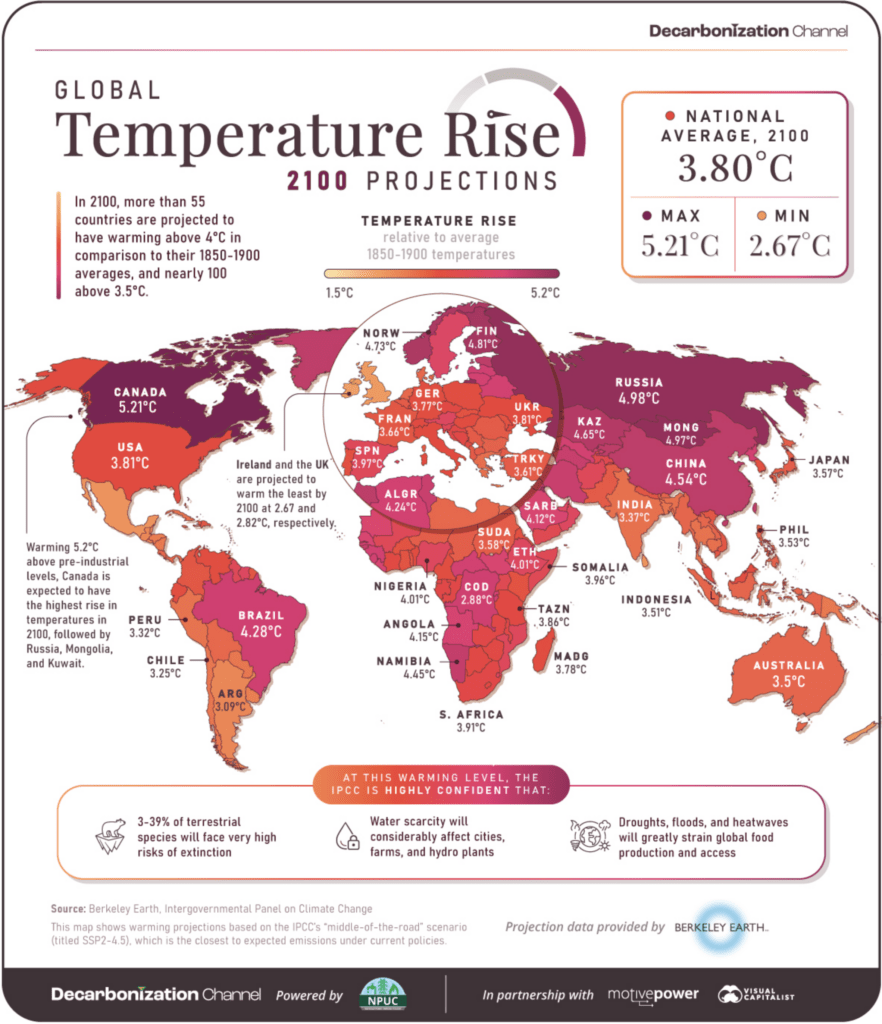
Mapped: Global Temperature Rise by Country (2022-2100P) How to use: Click on the arrows on the side to toggle between years.[dipl_image_card_carousel cards_per_slide="1" show_arrow="on" previous_slide_arrow="||divi||400"...
Visualized: Per Capita Electricity Emissions, by State
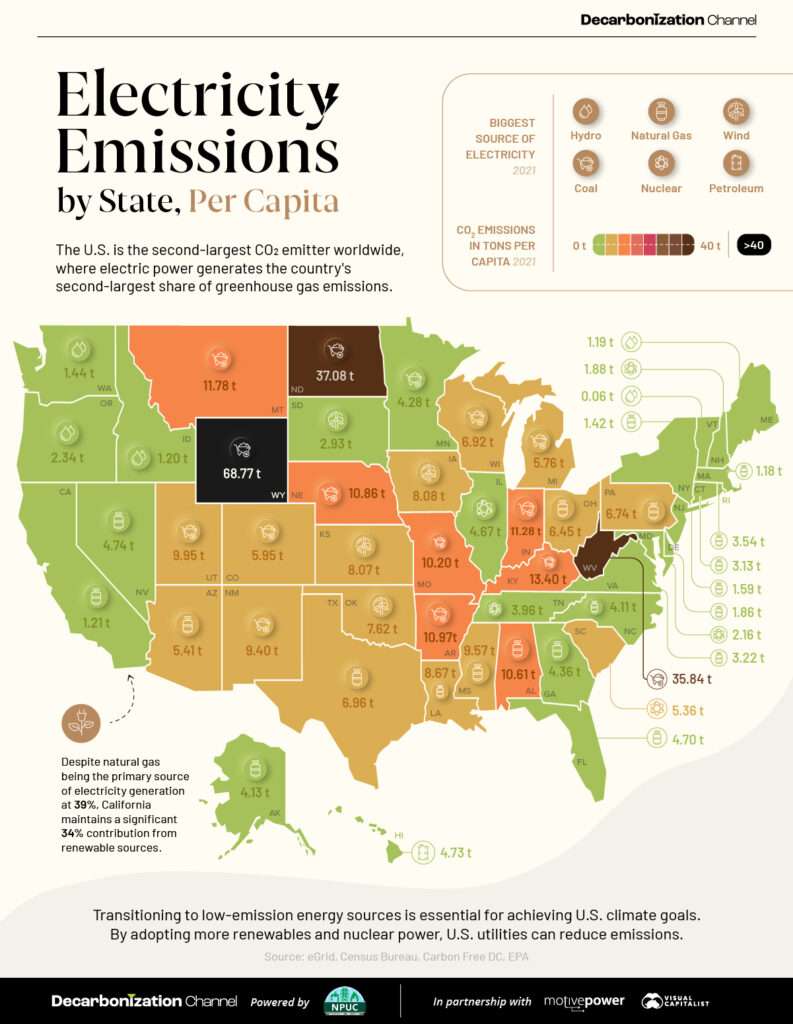
Per Capita Electricity Emissions by State The U.S. is the second-largest CO₂ emitter worldwide, with electric power contributing significantly to the country’s greenhouse gas (GHG) emissions. In collaboration with the National Public Utilities Council, this graphic...
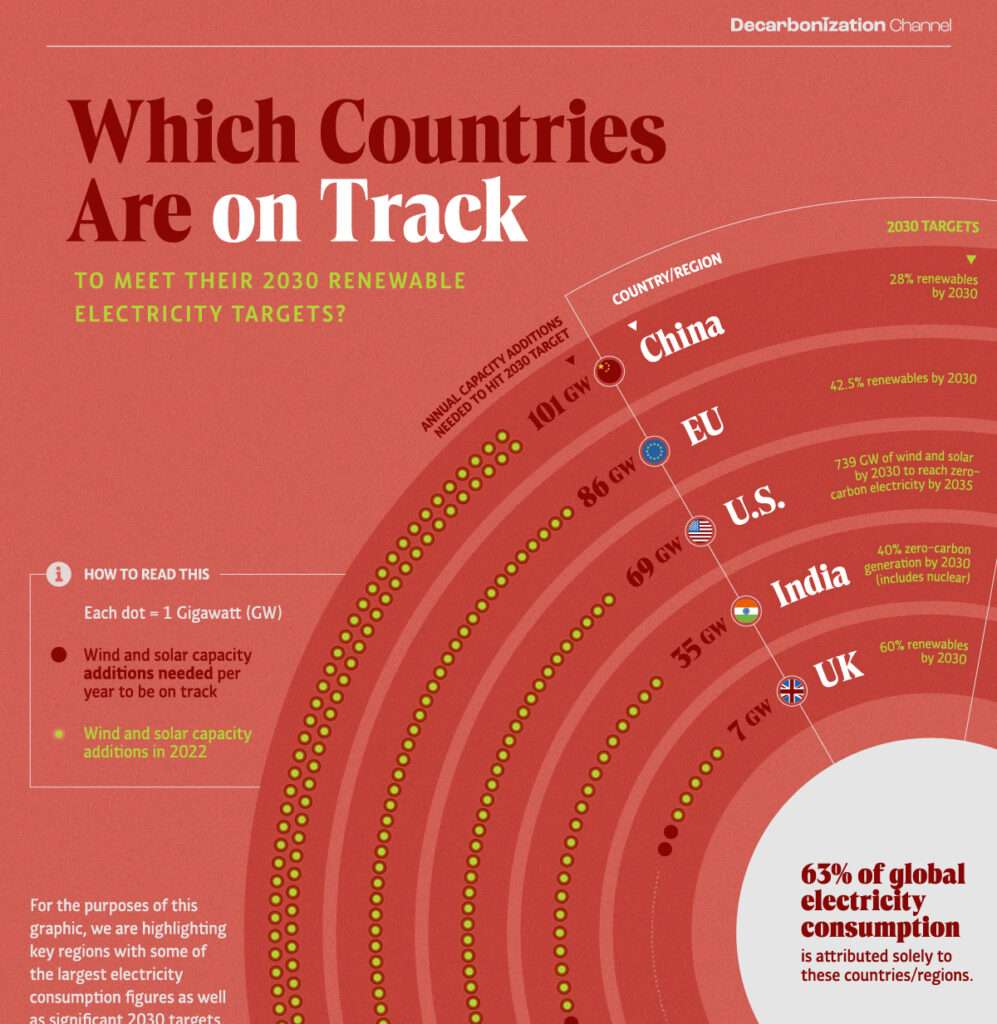
Progress on 2030 Renewable Energy Targets by Country
Progress on 2030 Renewable Energy Targets by Country The International Energy Agency states that the global installed capacity of renewable energy must triple by 2030 to limit global warming to 1.5°C above pre-industrial levels. This makes the next six years...
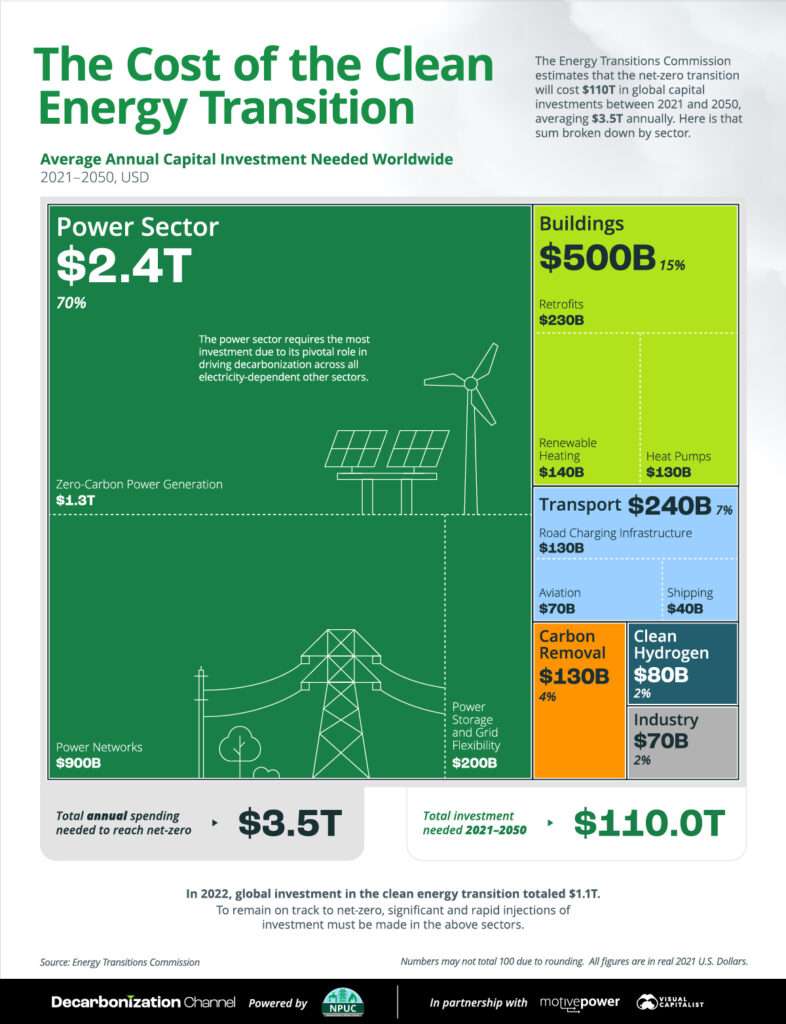
Breaking Down the $110 Trillion Cost of the Clean Energy Transition
The $110 Trillion Clean Energy Transition Cost The Energy Transitions Commission estimates that achieving net zero by 2050 requires an average annual investment of $3.5 trillion globally between 2021 and 2050. That’s a total of $110 trillion in capital investment,...