Mapped: Global Temperature Rise by Country (2022-2100P)

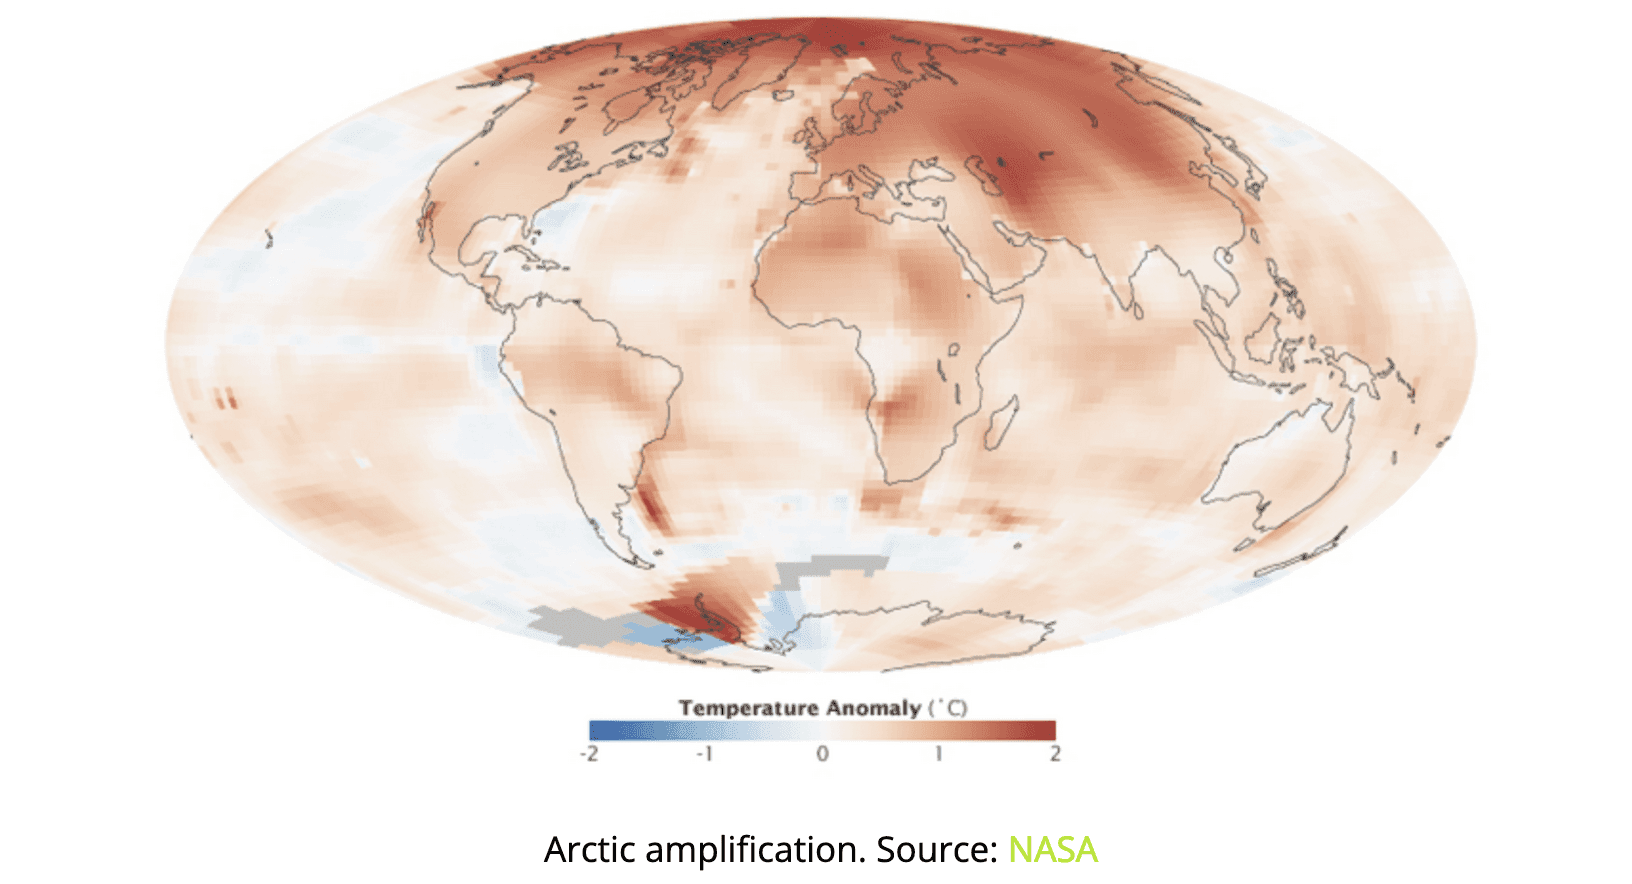
Aside from modern-day observations, the effects of Arctic amplification are also clearly seen in climate models, where accelerated warming in countries such as Russia and Canada is seen through 2100.
Projected Warming in 2050 and 2100
Moving over to the second and third maps in the slides above, we discover country-level 2050 and 2100 warming projections.
These projections are based on the IPCC’s “middle-of-the-road” scenario, titled Shared Socioeconomic Pathway (SSP) 2-4.5. Out of the various established pathways, this one is the closest to expected emissions under current policies.
2050 Projections
Under the SSP2-4.5 scenario, average national warming is projected to be 2.75°C above average 1850-1900 temperatures in 2050. This includes Mongolia, with the most substantial warming of 3.76°C, and New Zealand, with the mildest warming of 2.02°C.
To put those temperatures into context, here are the risks that would likely accompany them, according to the IPCC’s latest assessment report.
Extreme weather events will be more frequent and intense, including heavy precipitation and related flooding and cyclones.
Nearly all ecosystems will face high risks of biodiversity loss, including terrestrial, freshwater, coastal and marine ecosystems.
Accelerated sea level rise will threaten coastal cities, leading to mass displacement.
Let’s now take a look at 2100 projections, which would have significantly higher levels of risk unless fast and extreme mitigation and adaptation measures are implemented in the upcoming decades.
2100 Projections
2100 projections under the SSP2-4.5 scenario depict an average national warming of 3.80°C.
More than 55 countries across the globe are projected to have warming above 4°C in comparison to their 1850-1900 averages, and nearly 100 above 3.5°C.
Here is what those levels of warming would likely mean, according to the IPCC.
3-39% of terrestrial species will face very high risks of extinction.
Water scarcity will considerably affect cities, farms, and hydro plants, and about 10% of the world’s land area will experience rises in both exceptionally high and exceptionally low river flows.
Droughts, floods, and heatwaves will pose substantial threats to global food production and accessibility, eroding food security and impacting nutritional stability on a significant scale.
Generally, warming at this level is expected to pose substantial catastrophic risks to humanity, necessitating swift and bold climate action.
Learn more about how electric utilities and the power sector can lead on the path toward decarbonization here.


