Gain sustainability insights from the perspective and expertise acquired from working with some of the best clients in the world.
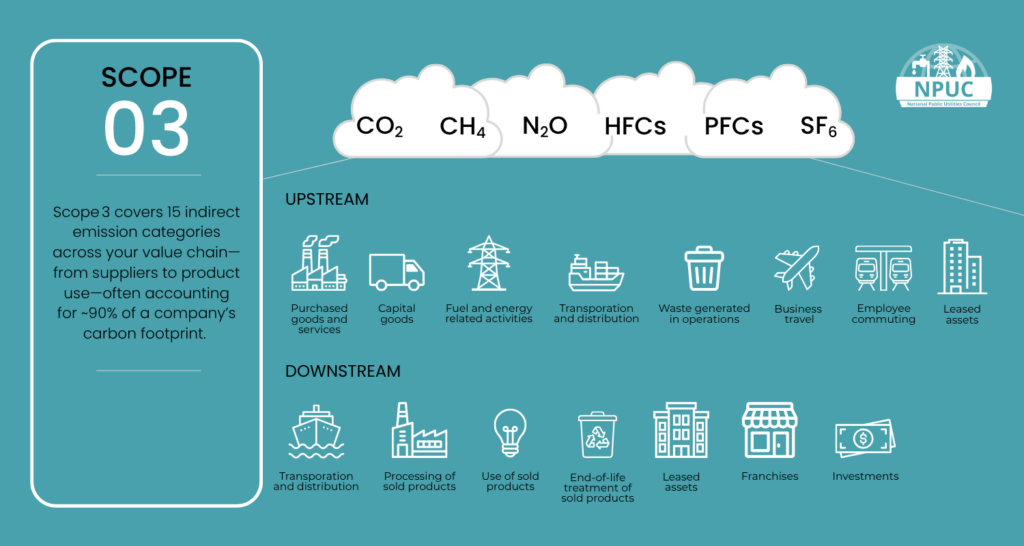
Understanding Scope 3 and 4 Emissions
Understanding Scope 3 and 4 Emissions A Guide for Utilities and Sustainability ProfessionalsThe path to achieving meaningful decarbonization is intricate and multi-layered, especially for sectors like utilities that have high emissions and complex supply chains....
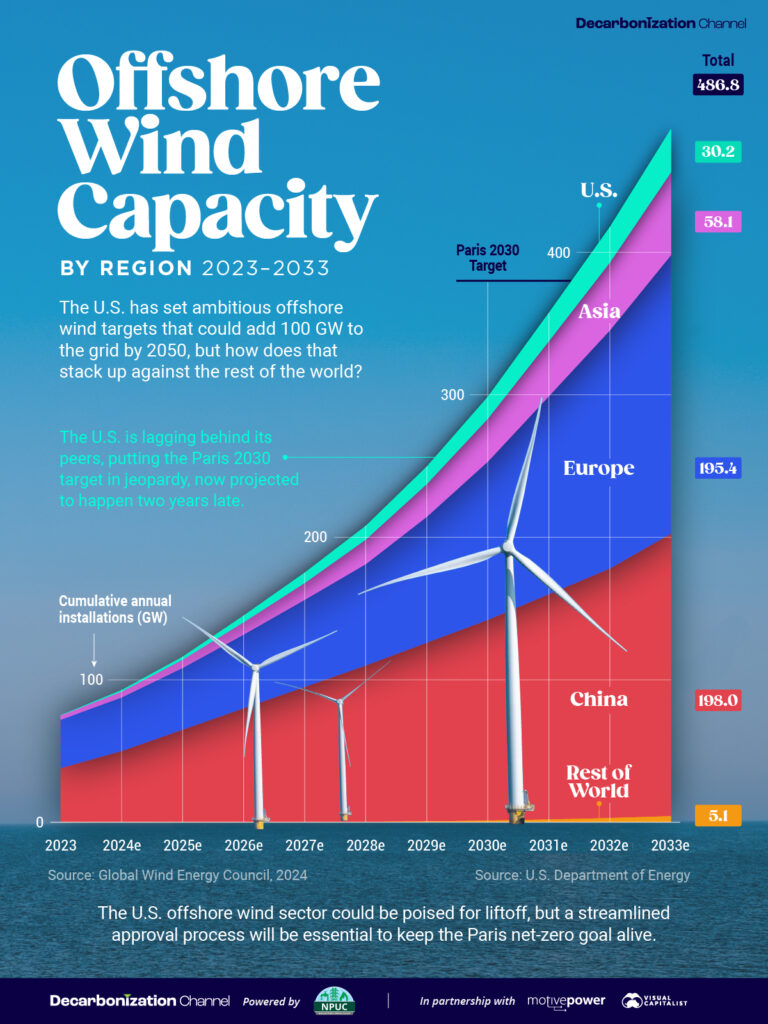
Visualized: Offshore Wind Installations by Region (2023–2033)
Visualized: Offshore Wind Installations by Region (2023–2033) In order to meet the 1.5°C trajectory outlined in the Paris Agreement, the world will need 380 GW of cumulative offshore wind capacity by 2030, expanding to 2,000 GW by 2050. But can it be achieved? The...
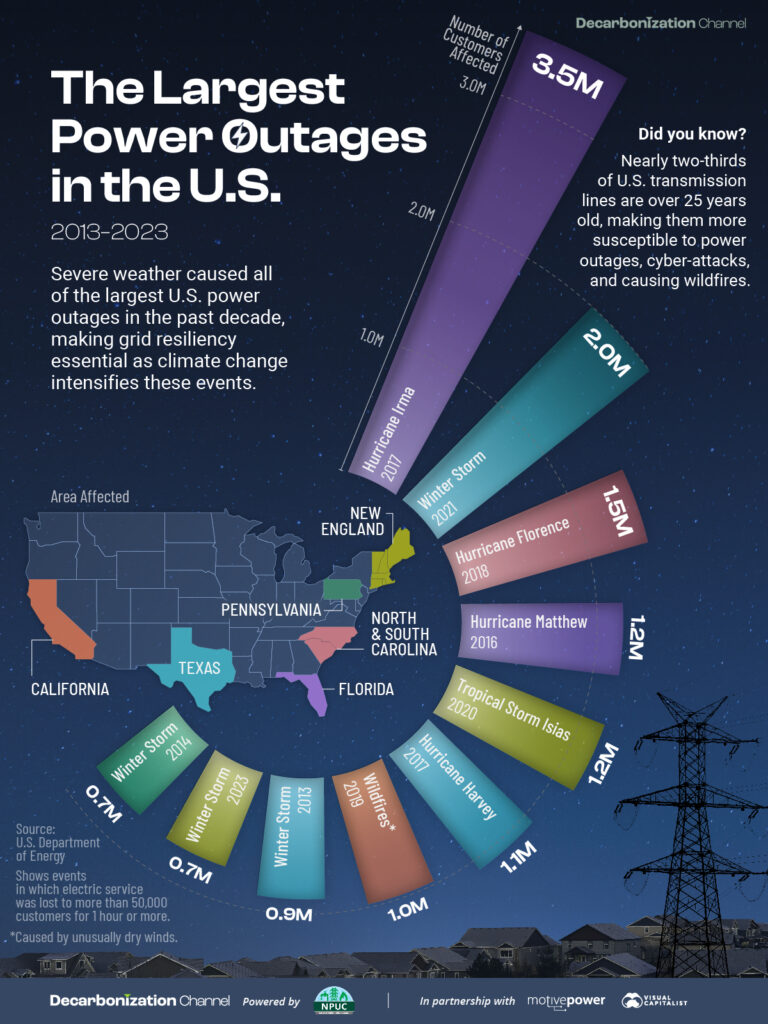
Ranked: The Largest Power Outages in the U.S. (2013–2023)
Ranked: The Largest Power Outages in the U.S. (2013–2023)Power outages—whether due to operational failures, extreme weather, vandalism, or fuel shortages—can have far-reaching impacts on both customers and utility companies. Created in partnership with The National...
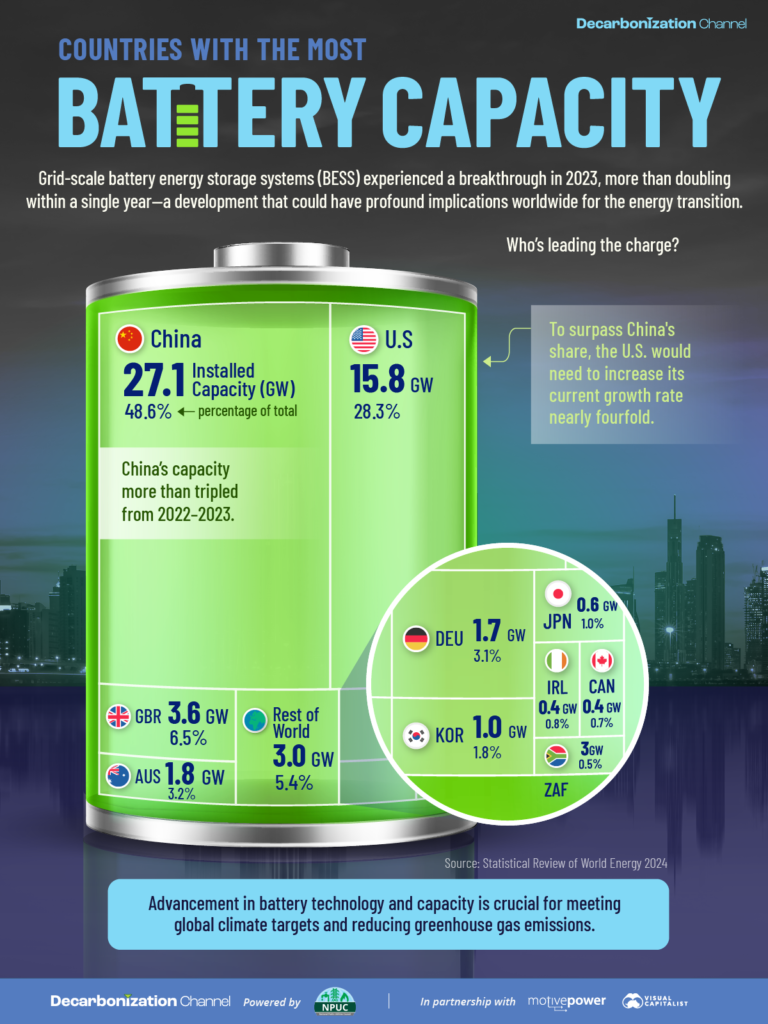
Visualized: Countries by Grid Storage Battery Capacity in 2023
Visualized: Countries by Grid Storage Battery Capacity in 2023?According to the International Energy Agency, 1,300 GW of battery storage will be needed by 2030 to support the renewable energy capacity required to meet the 1.5°C global warming target. But how close...

Data Maturity Valley: Identifying and Mitigating Inexorable Inefficiencies in the face of Multi-Platform Integration
Data Maturity Valley Identifying and Mitigating Inexorable Inefficiencies in the face of Multi-Platform IntegrationIntroduction As data continually cements itself as ‘language of doing business’, the impetus is increasingly on firms to maintain their literacy in...
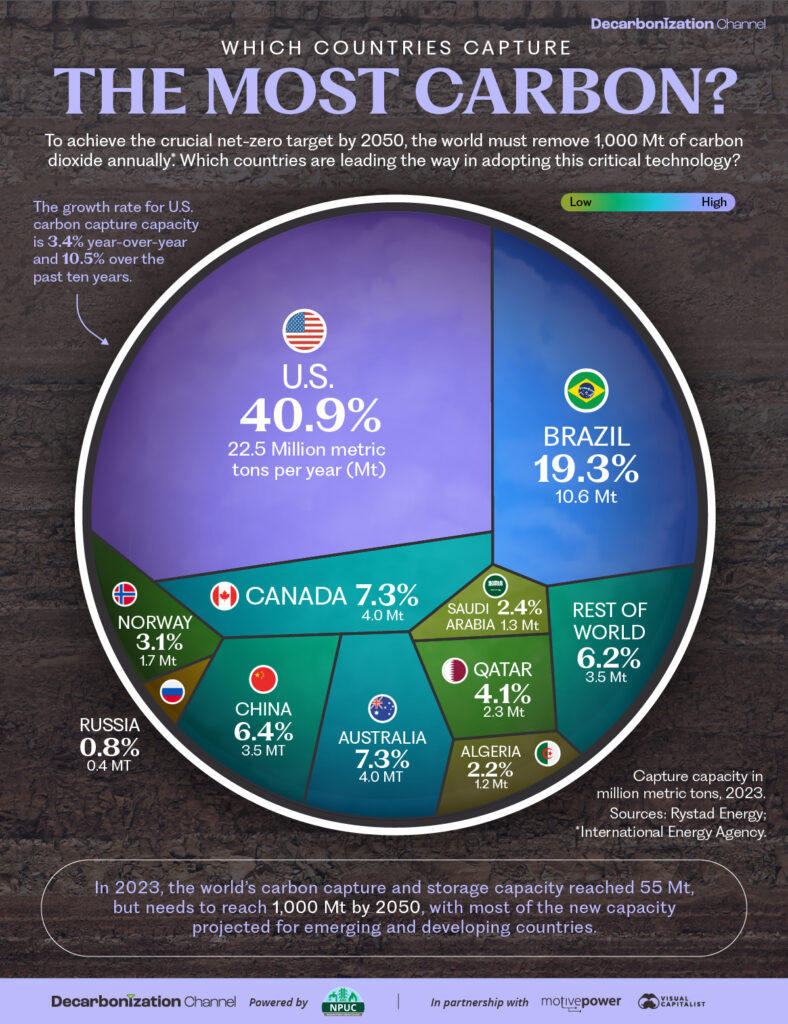
Visualized: Which Countries Capture the Most Carbon?
Visualized: Which Countries Capture the Most Carbon?In 2023, most carbon capture, utilization and storage (CCUS) capacity came from only two countries, which captured 33 million metric tons combined. However, according to the IEA, we must remove one billion metric...