NPUC Magic Radar Report
Scope 3 is where things get complicated. This report cuts through the confusion.

Fast Facts
What's Inside
One visual. Every utility.
See where 46 utilities stand on emissions reporting, reduction progress, and net zero targets, all in one visual.
Find out which utilities are reporting on Scope 1, 2, and all 15 Scope 3 categories, and which are not.
Get a closer look at one top-performing utility that is ahead of the curve on Scope 3, with lessons others can use.
Get clear answers to the questions everyone is asking: Scope 4? Supplier data? What actually counts.
Understand what it really takes to own your emissions story, fill the gaps, and make smarter moves toward net zero.
Inside Look
About This Edition
One visualization. The full picture.
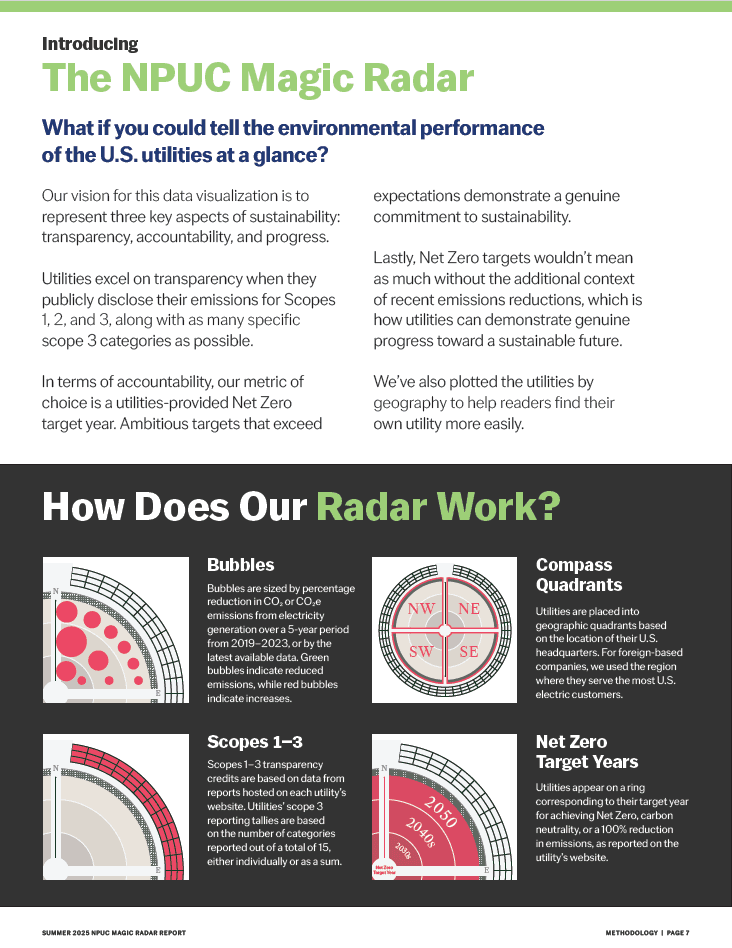
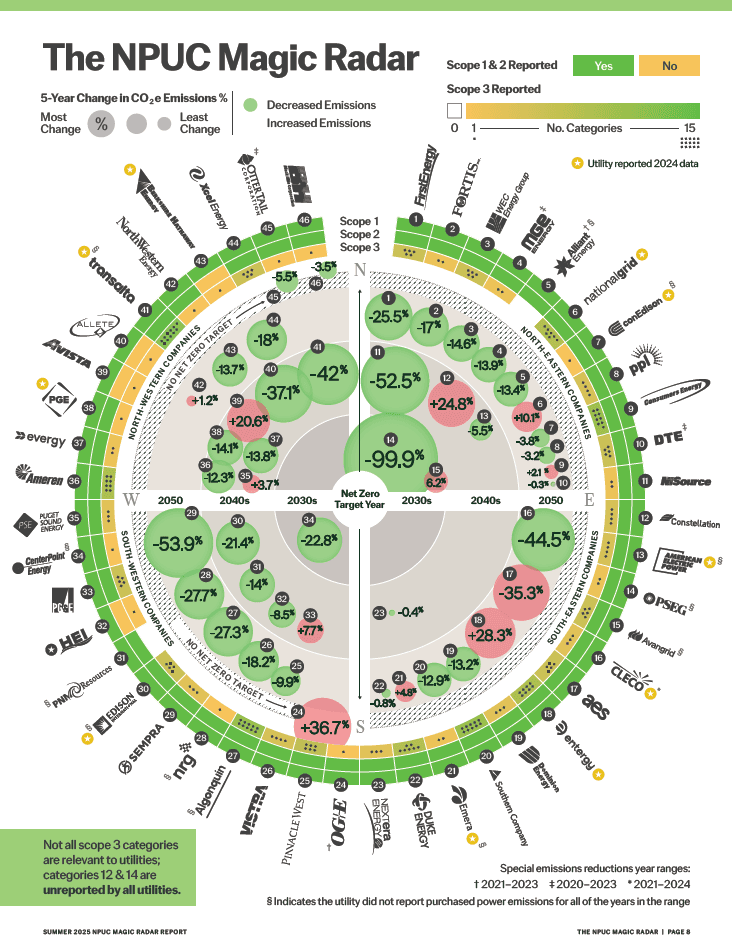
The Magic Radar maps 46 U.S. investor-owned utilities across emissions reporting, reduction progress, and net zero commitments in a single visual framework. Bubble size reflects percentage reduction in CO2 emissions over five years. Position reflects Scope transparency and net zero timeline. It is designed to make the data immediate and actionable without requiring a deep read to understand where each utility stands.
Get the full Magic Radar Report.
Free to access. Fill out the form for instant download.
Start a conversation