Visualized: Global CO2 Emissions Through Time (1950–2022)

Data note: 1950 was used as a beginning point for the graph due to the lack of available data for many countries prior to that year.
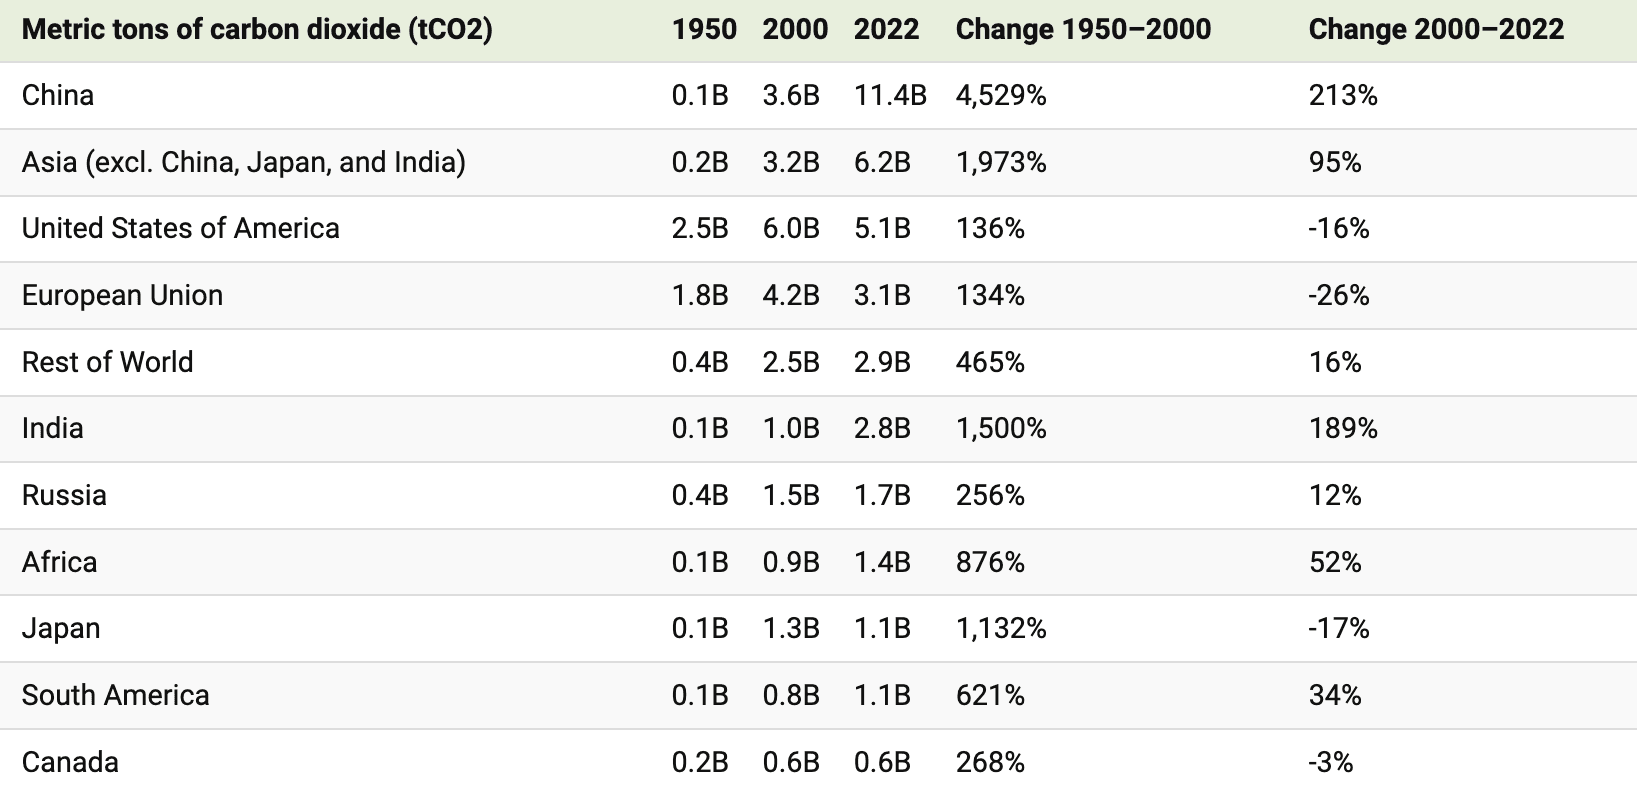
As illustrated in the table above, the growth in global carbon emissions has slowed since 2000.
With that said, global emissions have still risen from 25 billion tonnes in 2000 to 37 billion in 2022, which is another all-time high. Today, over 40% of emissions come from the U.S. and China, underscoring their pivotal roles in shaping the global emissions landscape.
Where Are We Headed From Here?
The United Nations’ recent Emissions Gap report highlights a concerning reality: the ongoing rate of emissions combined with existing policies steers humanity towards a world that is 3°C warmer than pre-industrial levels. This contrasts starkly with the goals of 1.5–2°C agreed to in 2015.
The Intergovernmental Panel on Climate Change projects that such a degree of warming will potentially result in catastrophic repercussions, from severe changes in weather patterns to rising sea levels, widespread extinctions, and critical disruptions to global food and water systems.
Learn more about how electric utilities and the power sector can lead on the path toward decarbonization here.


