Emissions per Capita of the Top 30 U.S. Investor-Owned Utilities
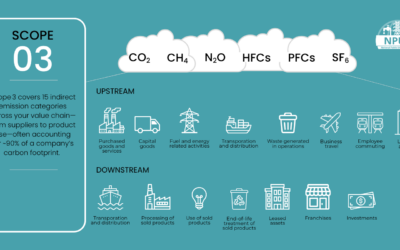
Approximately 25% of all U.S. greenhouse gas emissions (GHG) come from electricity generation.
Subsequently, this means investor-owned utilities (IOUs) will have a crucial role to play around carbon reduction initiatives. This is particularly true for the top 30 IOUs, where almost 75% of utility customers get their electricity from.
This infographic from the National Public Utilities Council ranks the largest IOUs by emissions per capita. By accounting for the varying customer bases they serve, we get a more accurate look at their green energy practices. Here’s how they line up.
Per Capita Rankings
The emissions per capita rankings for the top 30 investor-owned utilities have large disparities from one another.
Totals range from a high of 25.8 tons of CO2 per customer annually to a low of 0.5 tons.

PNM Resources data is from 2019, all other data is as of 2020
Let’s start by looking at the higher scoring IOUs.
TransAlta
TransAlta emits 25.8 tons of CO2 emissions per customer, the largest of any utility on a per capita basis. Altogether, the company’s 630,000 customers emit 16.3 million metric tons. On a recent earnings call, its management discussed clear intent to phase out coal and grow their renewables mix by doubling their renewables fleet. And so far it appears they’ve been making good on their promise, having shut down the Canadian Highvale coal mine recently.
Vistra
Vistra had the highest total emissions at 97 million tons of CO2 per year and is almost exclusively a coal and gas generator. However, the company announced plans for 60% reductions in CO2 emissions by 2030 and is striving to be carbon neutral by 2050. As the highest total emitter, this transition would make a noticeable impact on total utility emissions if successful.
Currently, based on their 4.3 million customers, Vistra sees per capita emissions of 22.4 tons a year. The utility is a key electricity provider for Texas, ad here’s how their electricity mix compares to that of the state as a whole:

Despite their ambitious green energy pledges, for now only 1% of Vistra’s electricity comes from renewables compared to 24% for Texas, where wind energy is prospering.
Based on those scores, the average customer from some of the highest emitting utility groups emit about the same as a customer from each of the bottom seven, who clearly have greener energy practices. Let’s take a closer look at emissions for some of the bottom scoring entities.
Utilities With The Greenest Energy Practices
Groups with the lowest carbon emission scores are in many ways leaders on the path towards a greener future.
Exelon
Exelon emits only 3.8 tons of CO2 emissions per capita annually and is one of the top clean power generators across the Americas. In the last decade they’ve reduced their GHG emissions by 18 million metric tons, and have recently teamed up with the state of Illinois through the Clean Energy Jobs Act. Through this, Exelon will receive $700 million in subsidies as it phases out coal and gas plants to meet 2030 and 2045 targets.
Consolidated Edison
Consolidated Edison serves nearly 4 million customers with a large chunk coming from New York state. Altogether, they emit 1.6 tons of CO2 emissions per capita from their electricity generation.
The utility group is making notable strides towards a sustainable future by expanding its renewable projects and testing higher capacity limits. In addition, they are often praised for their financial management and carry the title of dividend aristocrat, having increased their dividend for 47 years and counting. In fact, this is the longest out of any utility company in the S&P 500.
A Sustainable Tomorrow
Altogether, utilities will have a pivotal role to play in decarbonization efforts. This is particularly true for the top 30 U.S. IOUs, who serve millions of Americans.
Ultimately, this means a unique moment for utilities is emerging. As the transition toward cleaner energy continues and various groups push to achieve their goals, all eyes will be on utilities to deliver.