Visual Capitalist
DOWNLOADABLE RESOURCES
All things utilities and decarbonization
Data Maturity Valley: Identifying and Mitigating Inexorable Inefficiencies in the face of Multi-Platform Integration
Data Maturity Valley Identifying and Mitigating Inexorable Inefficiencies in the face of Multi-Platform IntegrationIntroduction As data continually cements itself as ‘language of doing business’, the impetus is increasingly on firms to maintain their literacy in...
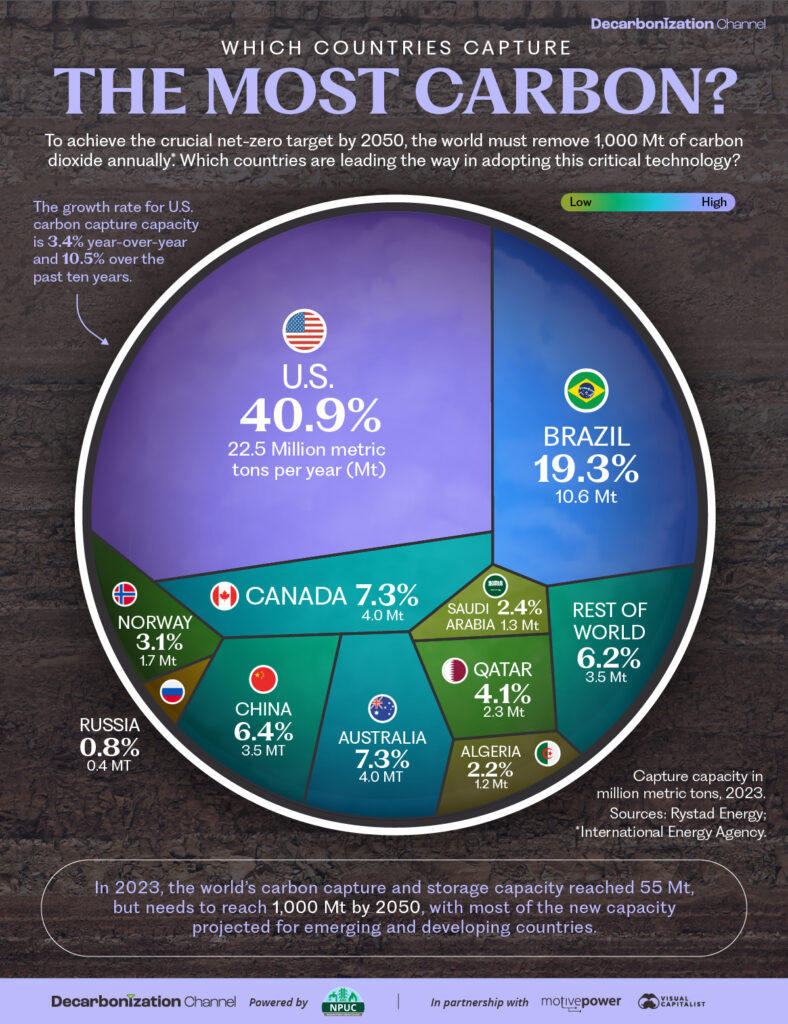
Visualized: Which Countries Capture the Most Carbon?
Visualized: Which Countries Capture the Most Carbon?In 2023, most carbon capture, utilization and storage (CCUS) capacity came from only two countries, which captured 33 million metric tons combined. However, according to the IEA, we must remove one billion metric...
Ranked: Energy Transition Scores by Country in 2024
Ranked: Energy Transition Scores by Country in 2024Ranked: Energy Transition Scores by Country in 2024 The World Economic Forum (WEF) recently unveiled their 2024 Energy Transition Report, which assesses 120 countries around the world on their decarbonization...
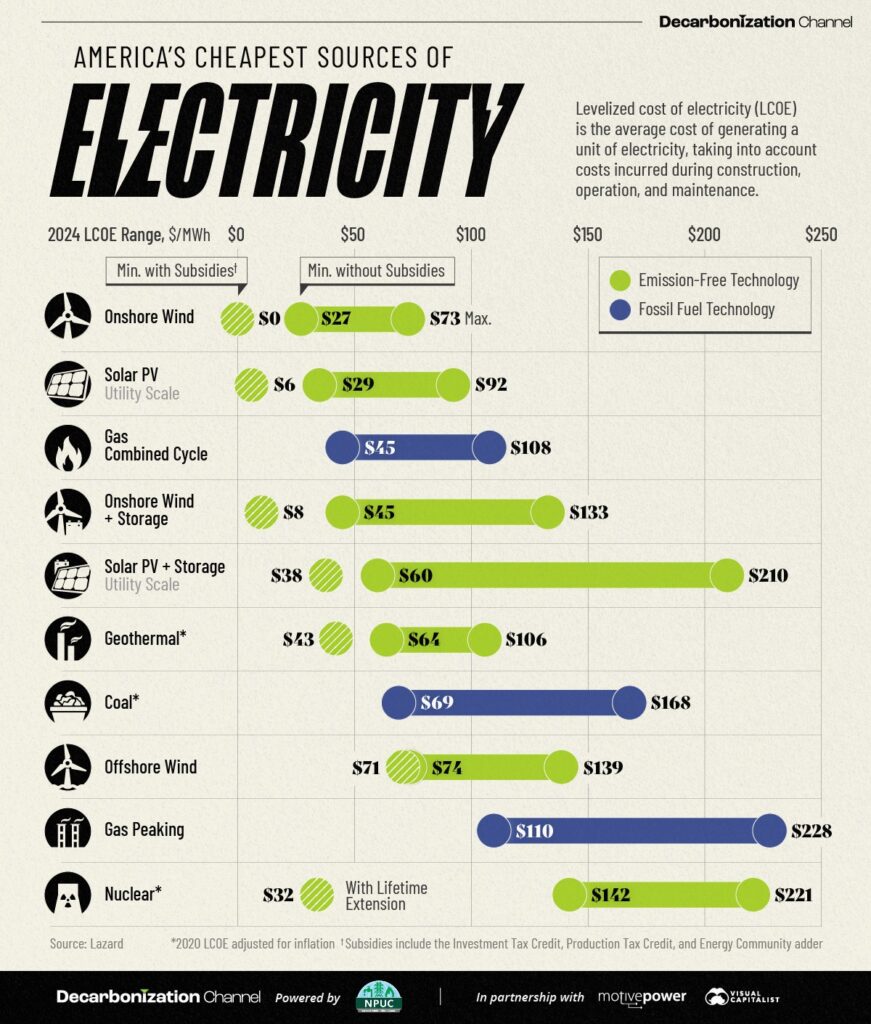
Ranked: America’s Cheapest Sources of Electricity in 2024
Ranked: America’s Cheapest Sources of Electricity in 2024 In the evolving global energy landscape, renewable sources are becoming increasingly cost effective. Even without subsidies, renewables are often the cheapest option available. This chart, created in...

Visualized: Emission Reduction Targets by Country in 2024
Visualized: Emission Reduction Targets by Country in 2024Since 2021, another 40 countries have established climate goals for 2030. However, the path to net zero remains uneven. With average national warming already 1.81°C above pre-industrial levels, the...
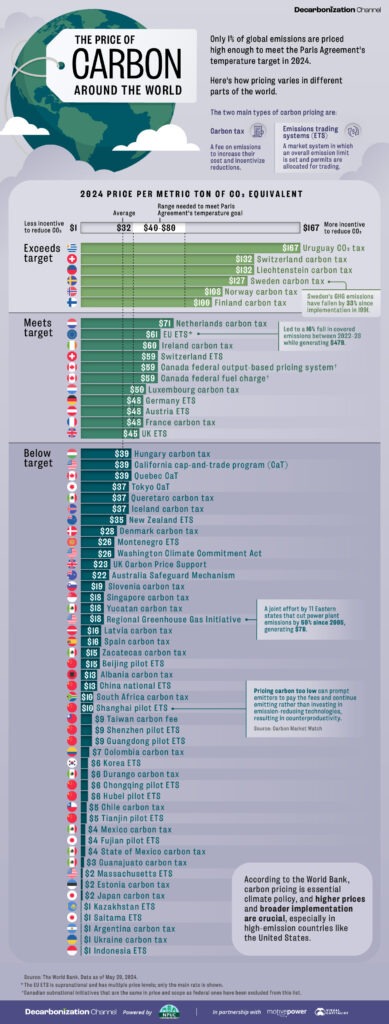
Visualized: The Price of Carbon Around the World
Visualized: The Price of Carbon Around the World Only 1% of global emissions are priced high enough to meet the Paris Agreement’s temperature target in 2024. This chart, created in partnership with the National Public Utilities Council, shows carbon prices...