Gridlock: Visualizing the U.S. Clean Energy Backlog
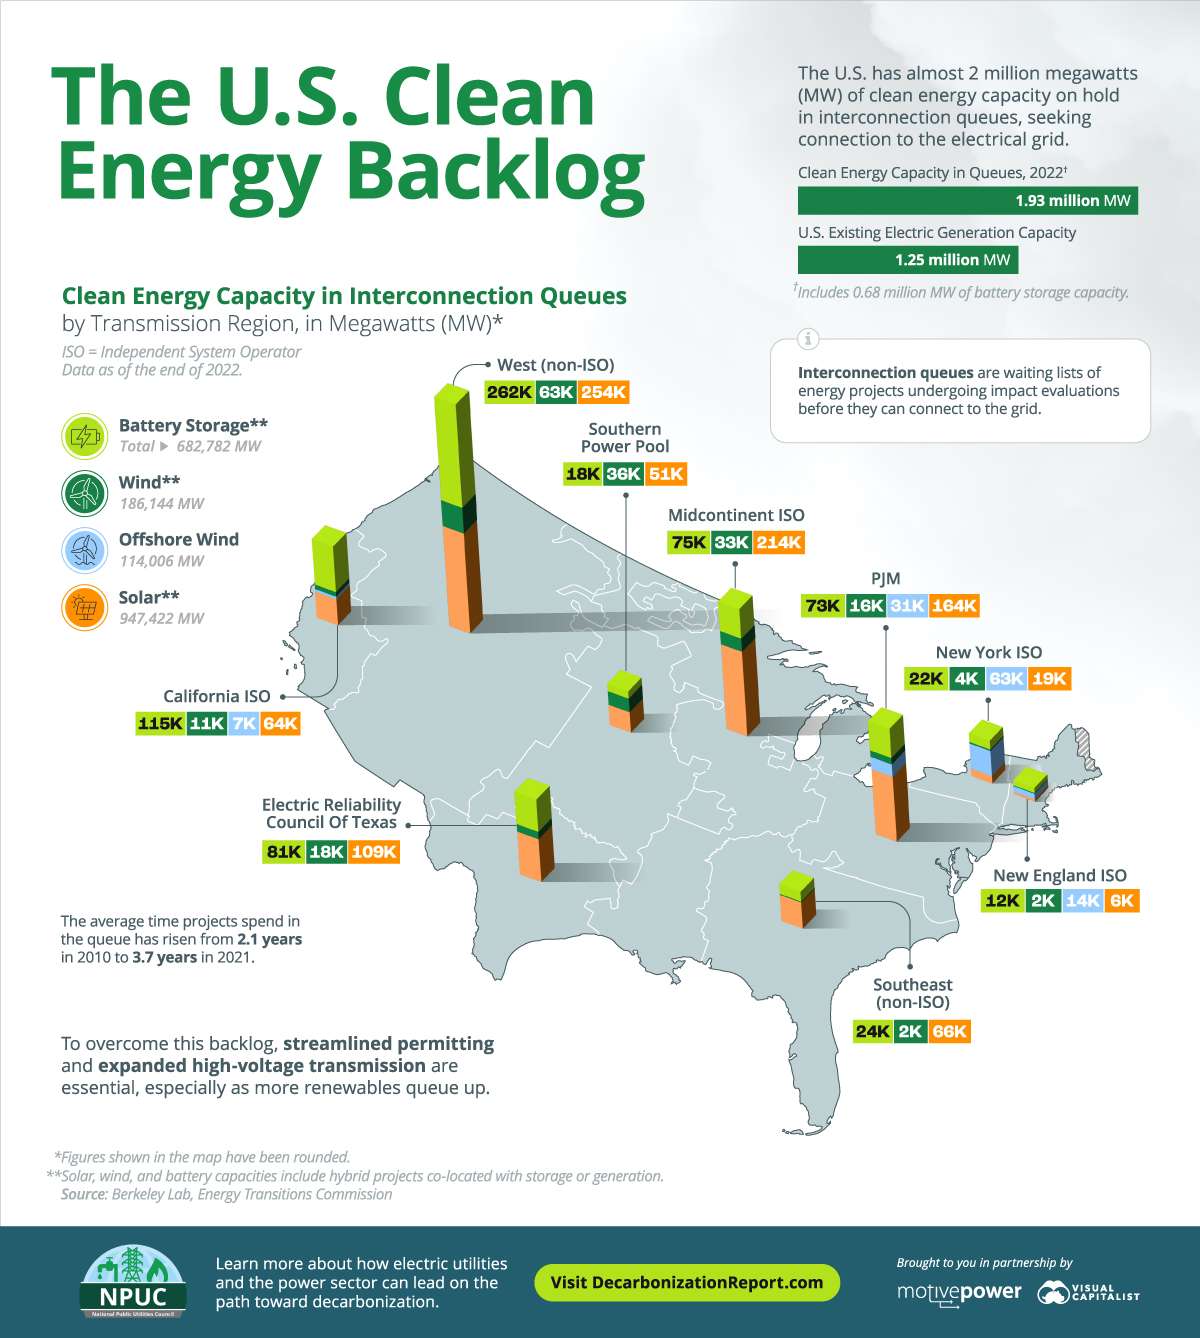
The U.S. has almost 2 million megawatts (MW) of solar, wind, and storage capacity on hold in interconnection queues, seeking connection to the electrical grid.
However, the lack of transmission infrastructure, in addition to a lengthy permitting process, has resulted in a bottleneck of clean energy projects awaiting approval before they can be plugged into the grid.
This infographic sponsored by the National Public Utilities Council maps U.S. clean energy capacity in interconnection queues by transmission region, based on data from the Berkeley Lab.
But before we dive into the data, let’s fully understand what interconnection queues mean.
What are Interconnection Queues?
Before new power plants can be built and connected to the grid, they go through a series of impact assessments to ensure safety and reliability. The projects in this process form grid interconnection queues, which are essentially waitlists of proposed power plants seeking grid connection.
Here are some of the problems associated with U.S. interconnection queues:
- Wait times: The average time projects spend in the queue is up from 2.1 years in 2000 to 3.7 years in 2021, according to the Energy Transitions Commission.
- Withdrawal rates: Historically, most projects have withdrawn from the queue, with just 21% of projects seeking connection from 2000–2017 reaching commercial operation.
- Aging transmission: The U.S. grid is aging, and queued-up projects can end up facing large fees from the updates required to transmission infrastructure.
Although the backlog is alarming, the interconnection queues also show that project developers are invested in the clean energy transition. In fact, the amount of clean energy capacity in interconnection queues exceeds the amount needed to get to 90% zero-carbon electricity by 2035, according to Berkeley Lab.
U.S. Clean Energy in Queues
Solar and battery storage projects account for the majority of capacity in interconnection queues, followed by wind.
Notably, 48% of all solar capacity in the queues is proposed as a “hybrid plant” that combines generation with battery storage. Similarly, over half of all battery storage capacity is proposed with some amount of generation.
The large number of hybrid and storage configurations show that project developers are addressing the intermittent nature of renewables by combining generation with storage.
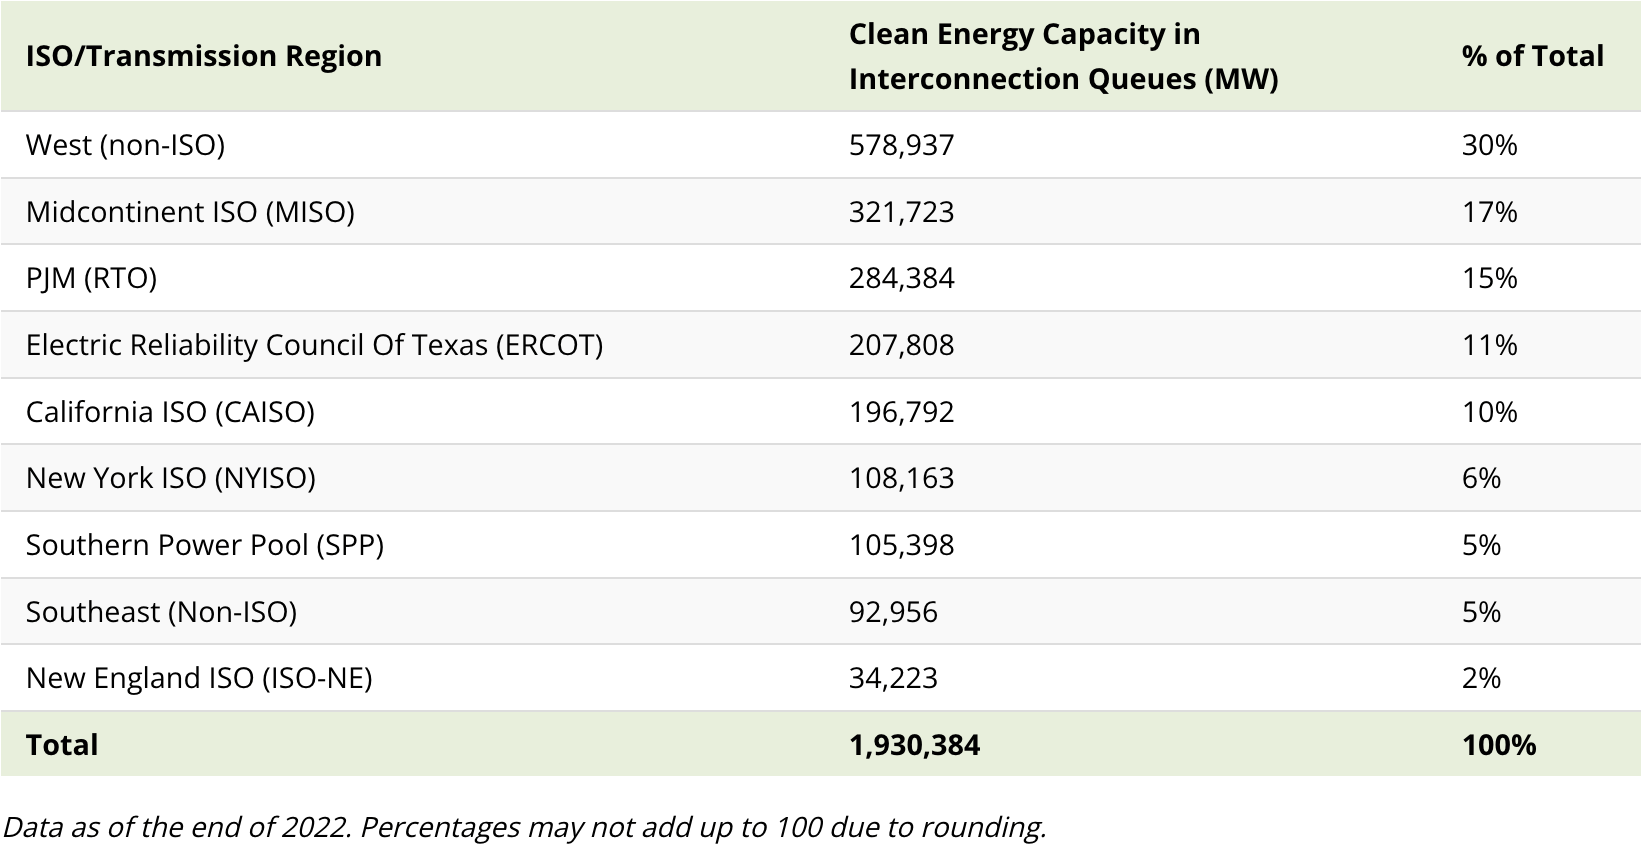
Interconnection queues are managed by Independent System Operators (ISOs) and Regional Transmission Organizations (RTOs) that operate the grid and wholesale electricity markets in different regions. Here’s a look at the clean energy capacity in queues grouped by major transmission regions and ISOs:
