Animated: 70 Years of U.S. Electricity Generation by Source
Electricity generation in the U.S. has grown exponentially since 1950, going from 2.96 billion kilowatt-hours (kWh) in 1949 to 4.11 trillion kWh in 2021.
With the growth in electricity generation, the U.S. electricity mix has also evolved, especially as clean electricity sources such as nuclear, wind, and solar power grew in use.
In the animated chart by the National Public Utilities Council above, we explore the past 70 years of U.S. electricity generation, following along with the country’s dynamic electricity mix over the decades.
Trends in U.S. Power Generation Since 1950
The U.S. generated 1,200% more electricity in 2021 compared to 1950.
Here’s how the share of each source in the electricity mix changed over that period.

While coal and hydropower led as the largest sources of electricity in the 1950s, the growth in U.S. electricity demand is met primarily by natural gas today, followed by coal, nuclear, and wind power.
Despite coal’s heavy share in the U.S. electricity mix since 1949, its use has declined in recent years, peaking in 2007 in terms of total electricity generated.
With the low cost of natural gas and the advancement of decarbonization efforts, 80+ coal plantshave retired or are set to retire in the next three decades in the United States. Despite this, coal remains the largest contributor to power sector emissions, accounting for 58% in 2021.
Besides the rise and fall of coal use, the animation highlights other interesting trends in the country’s power generation over the last 70 years, including:
- Nuclear energy slowly starts contributing to the electricity mix in 1957 as the Shippingport Atomic Power Station comes on in Pennsylvania. By 2020, nuclear power accounts for nearly 20% of total electricity generation.
- Solar and wind power start contributing to the mix in 1983-84, with wind accelerating faster than solar power to account for 1% of total electricity generated by 2008 and 9% by 2021.
- Electricity sourced from natural gas surpasses that from coal in 2016 and continues to absorb most of the decline in coal use through the present day.
- Hydropower’s share in the electricity mix remains stable since 2000, making up 5 to 6% of total electricity generated each year.
The Road to Net-zero
While the decline in coal use for electricity aids in lowering emissions, the U.S. power sector has a long way to go in decarbonizing. In 2021, the use of fossil fuels for power generation contributed 1,537 million tonnes of carbon dioxide emissions in the country.
Therefore, accelerating the deployment of carbon-free energy sources is critical for the road to a decarbonized power sector.
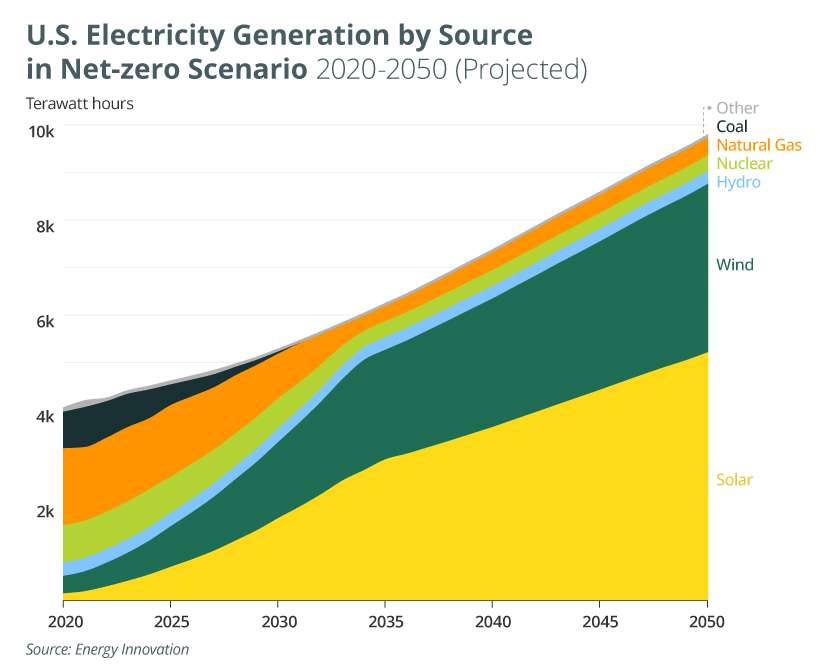
The chart below shows how U.S. electricity generation needs to change to achieve net-zero emissions by 2050.

In the net-zero scenario, Energy Innovation’s policy simulator counts on a complete phase-out of coal-fired electricity by 2034, along with a 36-fold increase in solar power generation and a 10-fold increase in wind power generation by 2050 (compared to 2020 levels.)
The rapid transition from fossil fuels to clean-energy sources, coupled with adequate transmission expansion and investment in battery storage, is integral for a carbon-free power sector. With prompt action, the next 30 years of U.S. electricity generation has the power to look a lot like the projected graph above, giving way to lower emissions for all other sectors that use electricity.


